


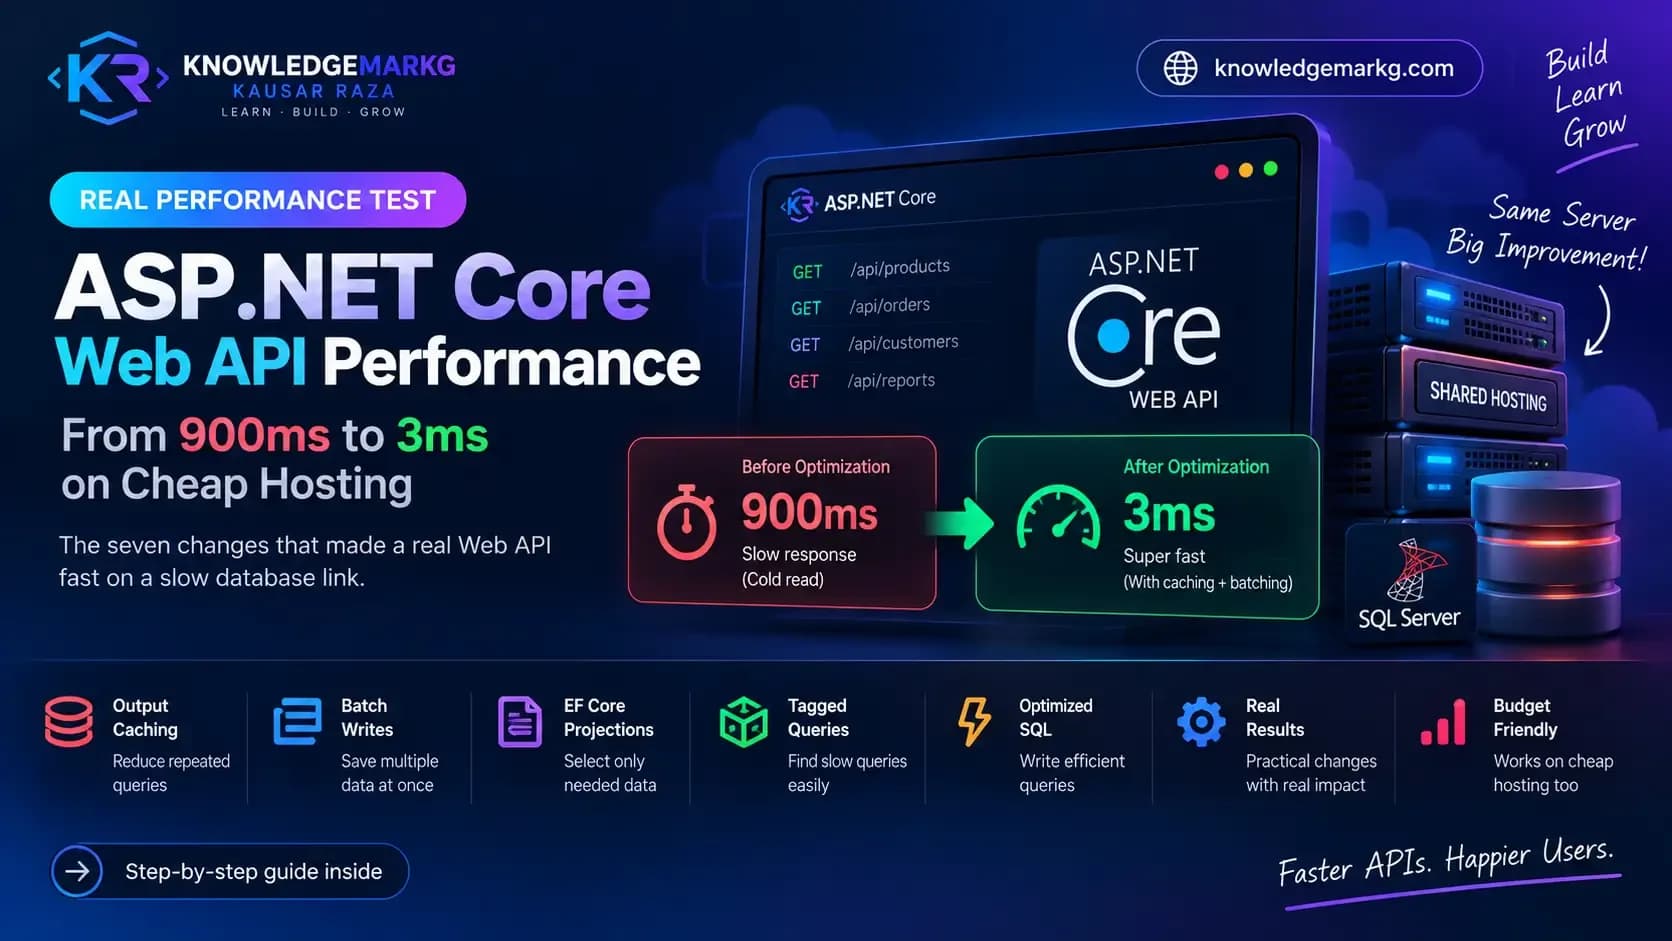
The ASP.NET Core Web API behind this site runs on a budget setup: an ASP.NET Core 9 app on one box, and SQL Server on shared hosting somewhere else entirely. Every query crosses a network I do not control. A cold read of the homepage payload took somewhere between 200 and 1000 milliseconds, and it was not the query plan that was slow. It was the distance.
Warm reads now come back in 2 to 3 milliseconds. Nothing was rewritten in C++ and nothing moved to Redis. Seven changes did it, and every one of them is available to you on the cheapest hosting you can find.
The constraint worth naming first
Most ASP.NET Core Web API performance advice quietly assumes your database is in the same data centre as your app. On managed cloud that is true. On the shared hosting most small projects actually run on, it is not.
When the database is 200 milliseconds away, the winning move stops being "make the query faster" and becomes "make fewer round trips, and stop repeating the ones you have already made". Almost everything below follows from that one sentence.
1. Project into DTOs. Never load entities
The single biggest change in the whole exercise. Every read path in the Web API goes straight from IQueryable into a DTO, so EF Core emits one flat SELECT with only the columns that will actually be serialised:
public static readonly Expression<Func<BlogPost, PostSummaryDto>> ToSummary =
    p => new PostSummaryDto(
        p.Id,
        p.Title,
        p.Slug,
        p.Excerpt,
        p.PublishedAt,
        p.Categories.Select(c => new TermDto(c.Id, c.Name, c.Slug)).ToList());
What this avoids matters more than what it does:
- No
Includefan-out. Loading a post with its categories and tags as entities pulls every column of every row, including the full article body you were not going to display in a list. - No change tracking. Projections into a non-entity type skip the tracker entirely - there is nothing to snapshot.
- No lazy-load surprises. A missing
Includecannot turn into an N+1 later, because there is no navigation to walk.
Storing these as Expression fields rather than methods keeps them composable: they sit in one file, and every endpoint reuses the same shape. When the DTO gains a field, one edit covers the whole API.
2. Pool the context, and default to no tracking
Two lines, applied once, at startup:
builder.Services.AddDbContextPool<ApplicationDbContext>(options =>
{
    options.UseSqlServer(connectionString, sql =>
    {
        sql.EnableRetryOnFailure(maxRetryCount: 3, maxRetryDelay: TimeSpan.FromSeconds(5));
        sql.CommandTimeout(30);
    });
    options.UseQueryTrackingBehavior(QueryTrackingBehavior.NoTracking);
}, poolSize: 128);
AddDbContextPool reuses context instances instead of building a new one per request, so the model and DI wiring are not re-resolved thousands of times a minute. NoTracking as the default is safe precisely because of the previous section - nothing here needs a change tracker, and the handful of write paths ask for tracking explicitly with AsTracking().
EnableRetryOnFailure is not optional on shared hosting. Remote database connections drop. Without retries that is a 500 for the visitor; with them it is a hiccup nobody sees.
3. Output caching, with tags
This is where the 3 milliseconds come from. Response caching is usually skipped because of the obvious objection: if I cache for five minutes, my edits take five minutes to appear. Tag-based eviction removes that objection completely.
Register a policy per content type:
options.AddPolicy("posts-policy", p => p
    .Expire(TimeSpan.FromMinutes(5))
    .Tag("posts")
    .SetVaryByQuery("page", "pageSize", "category", "tag", "search", "sort"));
Then have every write throw away exactly the tags it touched:
await cacheStore.EvictByTagAsync("posts", ct);
await cacheStore.EvictByTagAsync("taxonomy", ct);
The result is a cache with no staleness cost. Publishing a post evicts the post tags and the change is live immediately, while a tag nobody edited keeps serving from memory. A warm read never touches the database at all, which is why the network distance stops mattering.
Get SetVaryByQuery right or the cache becomes a bug. Every query parameter that changes the response has to be listed. Miss one - an author filter, say - and two different requests share one cached body, which is a data leak dressed up as a performance win.
4. One aggregated endpoint instead of five round trips
The homepage needs featured posts, latest posts, popular posts, categories and tags. Five endpoints is the tidy design, and on a remote database it is also five times the latency.
GET /api/v1/site/home returns all five in one response. The client makes one request, the server makes one trip. This is not clever, it is just counting - and on a slow link, counting round trips beats micro-optimising any one of them.
5. Never make a reader wait on a write
Every article view should increment a counter. Doing that inline means the reader waits for a write to a database on the other side of the country, in order to read something that was already rendered.
Instead the view goes onto a bounded channel and a background worker batches them:
private readonly Channel<PostViewEvent> _channel =
    Channel.CreateBounded<PostViewEvent>(new BoundedChannelOptions(10_000)
    {
        FullMode = BoundedChannelFullMode.DropWrite,
        SingleReader = true,
    });
A hosted service drains it every five seconds, up to 200 events at a time, and writes one batch. Two details are deliberate:
- Bounded, not unbounded. An unbounded channel under a traffic spike is a memory leak with a queue in front of it.
DropWritewhen full. If the choice is between losing a few analytics rows and making real visitors wait, the analytics lose. Say that out loud in a comment so the next person does not "fix" it.
6. The split-query decision, and why the default was wrong here
Post projections pull two collections - categories and tags. EF Core warns about this and suggests AsSplitQuery(), which avoids the cartesian join by issuing separate queries.
On this setup that advice is backwards. A split query trades duplicated rows for extra round trips, and round trips are the expensive thing here. With a handful of terms per post, the duplicated rows cost less than another 200 millisecond hop. So the behaviour is set explicitly:
sql.UseQuerySplittingBehavior(QuerySplittingBehavior.SingleQuery);Stating it explicitly also silences the warning honestly - the setting is a decision, not an oversight. If the database were local, or if a post had hundreds of tags, the right answer would flip. Measure your own link before copying either choice.
7. Compression, and a cache in front of the cache
Brotli and Gzip on JSON responses, at the fastest compression level rather than the smallest:
builder.Services.Configure<BrotliCompressionProviderOptions>(o =>
    o.Level = CompressionLevel.Fastest);
Maximum compression spends CPU to save bytes that were not the bottleneck. Fastest gets most of the size reduction for a fraction of the cost.
In front of all of it, the Next.js frontend keeps its own data cache, so a page that has not changed does not even ask the API. Two cache layers sound excessive until you notice they fail independently - if one is cold, the other still absorbs the hit.
What I did not bother with
Honesty is more useful than a longer list:
- Redis. A second service to run, pay for and monitor, to solve a problem in-memory output caching already solved on one box. Worth it when you scale past one instance. Not before.
- Compiled queries. Real, measurable, and completely lost in the noise next to a 200 millisecond network hop.
- Hand-written SQL. The projections already generate the query I would have written. Dapper would win microseconds and cost me the migrations.
- More indexes, at first. Indexes fix slow queries. My queries were not slow - my network was. Adding indexes before measuring is guessing.
How to find out where your own time goes
Before changing anything, get the number. Turn on EF Core command logging in development and read what it actually emits:
options.LogTo(Console.WriteLine, LogLevel.Information)
       .EnableSensitiveDataLogging();
Then ask three questions in order:
- How many queries per request? If a list endpoint issues one query per row, stop here and fix the N+1. Nothing else matters yet.
- How wide are they? A
SELECTnaming forty columns to render a card is a missing projection. - How far away is the database? Time a trivial query -
SELECT 1. That figure is the floor under every request you will ever serve, and it decides whether you should be optimising queries or eliminating them.
That last number is the one that reframed this whole exercise. Once I knew the floor was 200 milliseconds, caching stopped being an optimisation and became the architecture.
Worth knowing before you copy any of it
These choices suit a read-heavy Web API on a slow link. A write-heavy internal tool on a local database would want almost the opposite: tracking on, caching off, split queries, real indexes.
The transferable part is not the settings. It is measuring the floor first, then deciding whether your problem is slow work or repeated work. Mine was repeated work, and repeated work is the cheap kind to fix.
If you are deciding where to run any of this, ASP.NET Core does not need Windows hosting - and running SQL Server in a Docker container keeps the whole stack on one cheap Linux box. If you are still assembling the fundamentals, the full stack developer roadmap covers the ground around this.
And if you would rather someone else did it, this is what I do - send me the slow endpoint and I will tell you which of these seven it needs.

Join the conversation
No comments yet — be the first to share what you think.