


You ran your site through PageSpeed Insights, saw a wall of red and orange, and closed the tab. Most site owners do exactly that. The report lists thirty suggestions with no sense of which three matter, so nothing gets fixed.
This guide is the version I wish clients read before calling me. It covers the three Core Web Vitals as they stand in 2026, what each one actually measures, why most sites fail them, and the fixes I apply first when a slow site lands on my desk - in the order that moves the numbers most.
Core Web Vitals in 2026: the short version
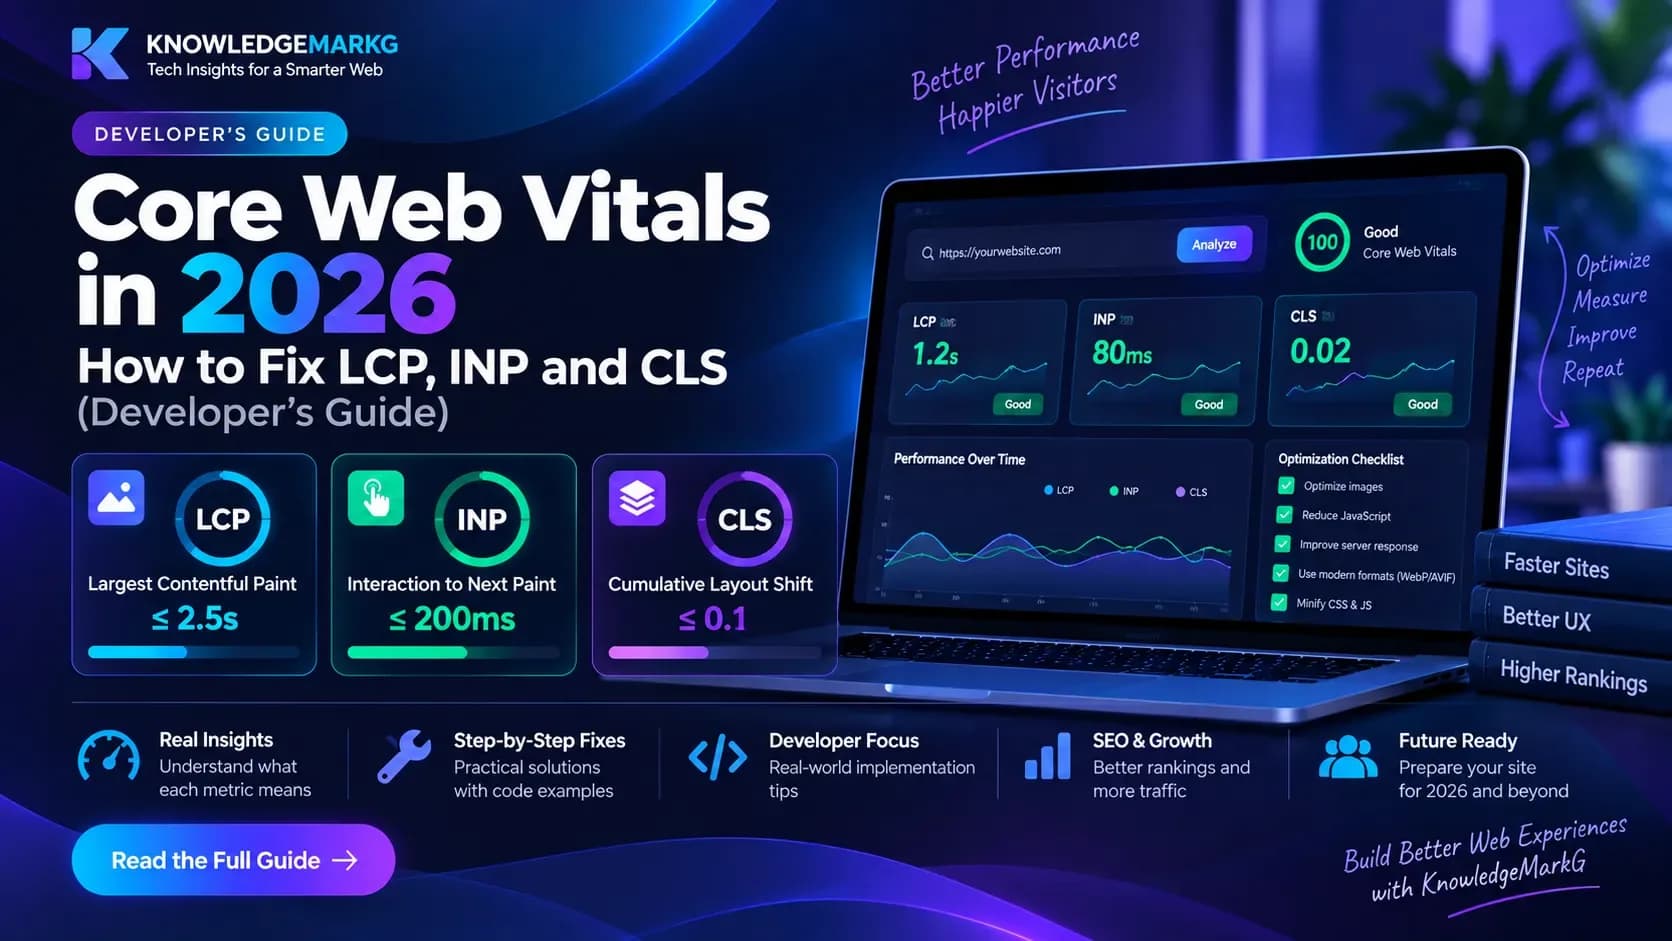
Core Web Vitals are three measurements Google uses to judge how a real visitor experiences your page: how fast the main content appears, how quickly the page reacts when someone taps, and whether things jump around while it loads.
| Metric | What it measures | Good | Needs improvement | Poor |
|---|---|---|---|---|
| LCP - Largest Contentful Paint | Loading: when the biggest image or text block appears | 2.5 s or less | 2.5 - 4.0 s | Over 4.0 s |
| INP - Interaction to Next Paint | Responsiveness: delay between a tap or key press and the screen updating | 200 ms or less | 200 - 500 ms | Over 500 ms |
| CLS - Cumulative Layout Shift | Visual stability: how much the layout jumps while loading | 0.1 or less | 0.1 - 0.25 | Over 0.25 |
Two rules make these numbers stricter than they look:
- They are measured on real visitors, at the 75th percentile. Your page passes only if three out of four visits are in the green. A fast laptop on office Wi-Fi does not count for much when most of your traffic is on mid-range phones.
- All three must pass. A perfect LCP does not rescue a page with a poor INP.
The thresholds have not changed since INP replaced the old First Input Delay metric in March 2024. What did change is browser support: since Safari 26.2 (December 2025), every major browser can measure LCP and INP, so the data now reflects iPhone users too - and many sites that looked fine suddenly did not.
How most websites are actually doing
If your site fails, you are in the majority on mobile. According to the HTTP Archive Web Almanac 2025, which analyses millions of real sites:
- Only 48% of mobile sites and 56% of desktop sites pass all three Core Web Vitals.
- On mobile, 62% have a good LCP, 77% a good INP and 81% a good CLS. Loading speed is the metric that fails most sites.
- For 76% of mobile pages, the largest element is an image - usually the hero banner.
- About 16-17% of pages lazy-load that hero image, which is one of the most common self-inflicted LCP problems.
- 62% of mobile pages have at least one image with no width and height set, the classic cause of layout shift.
The encouraging part: the most common failures are also the cheapest to fix.
Do Core Web Vitals affect Google rankings?
Yes, but honestly: less than most SEO tools suggest. Google says Core Web Vitals align with what its core ranking systems seek to reward, but a fast page with thin content will not outrank a slower page that answers the question better. Think of speed as a tie-breaker between similar pages, not a shortcut to the top.
The bigger payoff is usually not rankings at all. A page that appears in one second instead of five keeps more of the visitors you already paid to get - through ads, social posts or years of SEO. That is money you are currently losing at the door.
Step 1: Measure the right numbers first
Before fixing anything, get the field data - what real visitors experience - not just a lab score.
- PageSpeed Insights - the top section ("Discover what your real users are experiencing") is field data from Chrome users. The coloured score below it is a single simulated lab test. When they disagree, the field data is what Google uses.
- Google Search Console - Core Web Vitals report - groups your URLs into good, needs improvement and poor, so you fix a template once instead of page by page.
- Chrome DevTools - Performance panel - shows your own LCP, INP and CLS live as you click around, and tells you which element is the LCP element.
A new or low-traffic site often has no field data yet. In that case use the Lighthouse lab score as a guide, but test it with mobile throttling on, because that is closer to your real visitors.
Step 2: Fix LCP (loading speed)
LCP is the metric most sites fail, and it breaks down into four parts. Google's guidance is that roughly 40% of the time should go on the server response and about 40% on downloading the main image, with the two delays in between kept under 10% each:
- Time to First Byte (TTFB) - how long the server takes to start sending the page.
- Resource load delay - how long before the browser even starts fetching the hero image.
- Resource load duration - how long the image takes to download.
- Element render delay - how long between the image arriving and it appearing on screen.
Here are the fixes that move LCP most, in order.
Never lazy-load the hero image
loading="lazy" tells the browser to wait until it knows the image is in view - which, for the first thing on the page, just adds delay. Many themes and plugins apply it to every image automatically. Remove it from the first large image and tell the browser that image matters:
<img src="/images/hero.webp" alt="Our clinic reception"
     width="1200" height="675"
     fetchpriority="high">
Only about 17% of mobile pages use fetchpriority="high" on their LCP image, so this one attribute is still an easy win.
Make the image smaller, not just compressed
A 2,400-pixel photo shown in a 400-pixel phone screen is six times more image than the screen can use. Serve modern formats (WebP or AVIF) at the sizes the layout actually displays, using srcset so phones get the small version. Frameworks like Next.js do this automatically with their image component; on WordPress, a good image plugin does most of it.
Let the browser find the image early
If the hero image is set as a CSS background or inserted by JavaScript, the browser cannot see it until the CSS or script has loaded. Put it in the HTML as a normal <img> tag, or preload it:
<link rel="preload" as="image" href="/images/hero.webp" fetchpriority="high">Cut the server response time
If TTFB is over about 800 ms, no front-end trick will save the LCP. The usual causes are cheap shared hosting, no page caching, slow database queries, and chains of redirects (http to https to www to a trailing slash). Fixes, cheapest first:
- Turn on full-page caching so repeat visits skip the database.
- Put the site behind a CDN so the HTML is served from a location near the visitor.
- Remove redirect chains so every link points straight at the final URL.
- On custom applications, fix the slow queries - I covered this in detail in how to make an ASP.NET Core Web API faster.
- If the hosting itself is the bottleneck, move to a VPS - see Windows VPS vs Linux VPS for choosing one.
Stop render-blocking CSS and scripts
Every stylesheet and synchronous script in the <head> must finish before anything appears. Add defer to scripts that do not need to run first, remove plugins you no longer use, and load chat widgets, heatmaps and similar tools after the page has rendered.
Step 3: Fix INP (responsiveness)
INP measures every click, tap and key press during a visit (scrolling and hovering do not count) and reports roughly the worst one. Each interaction has three parts: input delay (the browser is busy with something else), processing (your code handling the event), and presentation delay (the browser drawing the result).
A poor INP almost always comes from too much JavaScript running on the main thread. The fixes:
Audit third-party scripts first
Analytics, tag managers, chat widgets, A/B testing tools, social embeds and ad scripts all compete for the same main thread as your menu button. On most slow business sites I review, removing two or three scripts nobody looks at any more fixes INP without touching the site's own code. Open DevTools, record a click in the Performance panel, and look at whose script is running when the click arrives.
Break up long tasks
Any piece of JavaScript that runs for more than 50 ms blocks every interaction until it finishes. Split long work into chunks and give the browser a chance to respond in between:
async function processItems(items) {
  for (const item of items) {
    handle(item);
    // Let the browser handle clicks and paint between items
    if (globalThis.scheduler?.yield) {
      await scheduler.yield();
    } else {
      await new Promise((resolve) => setTimeout(resolve, 0));
    }
  }
}
Show feedback first, do the heavy work after
When someone clicks "Add to cart", update the button straight away and send the request afterwards. The visitor sees an instant response, and INP measures that first paint - not the network request that follows.
Keep the page light
Very large pages - thousands of elements, long product grids, huge menus rendered on every page - make every update slower to draw. Paginate long lists, and only render what is visible.
Step 4: Fix CLS (layout shift)
CLS is the one visitors notice most: you go to tap a link, an image loads above it, and you tap an advert instead. The causes are few and well known.
Give every image and video a size
Set width and height on every image, or give its container an aspect-ratio. The browser then reserves the right space before the file arrives:
img { max-width: 100%; height: auto; }
.video-wrapper { aspect-ratio: 16 / 9; }
Reserve space for ads, embeds and banners
Ad slots, YouTube and map embeds, cookie banners and "subscribe" bars that push content down are the second biggest cause. Give each slot a fixed min-height, and show cookie banners as an overlay at the bottom rather than inserting them at the top of the page.
Tame web fonts
When a custom font replaces the fallback font, text can change size and push everything below it. Preload your main font file, and use font-display: optional or a size-matched fallback (size-adjust) so the swap does not move the layout.
Animate the right properties
Animations that change top, left, width or height move other elements. Use transform and opacity instead - they look the same and never shift the layout.
Common fixes by platform
- WordPress - the usual culprits are a heavy page-builder theme, 30-plus plugins and no caching. A caching plugin, an image optimisation plugin, and removing unused plugins often takes a site from red to green. If the theme itself is the problem, see WordPress or a custom website.
- Shopify and other hosted stores - TTFB is handled for you, so focus on apps. Every app can inject scripts on every page; uninstalling unused ones is the biggest INP win.
- Next.js and React sites - use the built-in image component with
priorityon the hero image, render pages on the server rather than in the browser, and keep client-side JavaScript to the interactive parts only. - Custom ASP.NET or PHP sites - server response time is usually the story: add output caching, compress responses, and fix slow database queries.
A 30-minute checklist
- Run PageSpeed Insights on your home page and your most important landing page; note the field data.
- Find the LCP element in DevTools. If it is an image, remove
loading="lazy"and addfetchpriority="high". - Check the hero image file size. If it is over about 200 KB, resize it and convert to WebP.
- Add
widthandheightto images that are missing them. - List every third-party script the site loads and remove the ones nobody uses.
- Turn on page caching and a CDN if you have neither.
- Re-test, then watch the Search Console report - field data takes about 28 days to fully update.
When to get a developer involved
The checklist above fixes a large share of sites. It will not fix a slow server application, a theme that loads 2 MB of JavaScript on every page, or a site built so that the content only appears after scripts run. Those need changes to how the site is built, and that is where a developer earns their fee.
I do this work regularly - measuring what real visitors experience, fixing the causes in order, and checking the results in the field data rather than a single lab score. See my website speed optimisation service, or get in touch for an honest look at what is slowing your site down and what it would take to fix. If your site is fast but still not bringing enquiries, read why your website is not getting customers.
Sources: Google web.dev Core Web Vitals, Optimize LCP, INP and Optimize CLS; HTTP Archive Web Almanac 2025 - Performance.



Join the conversation
No comments yet — be the first to share what you think.